
A walk through Priorita, screen by screen
Everything below is a capture of the running platform, not a mockup. This is what the growth cycle looks like once it is operating.
The first thing each person sees
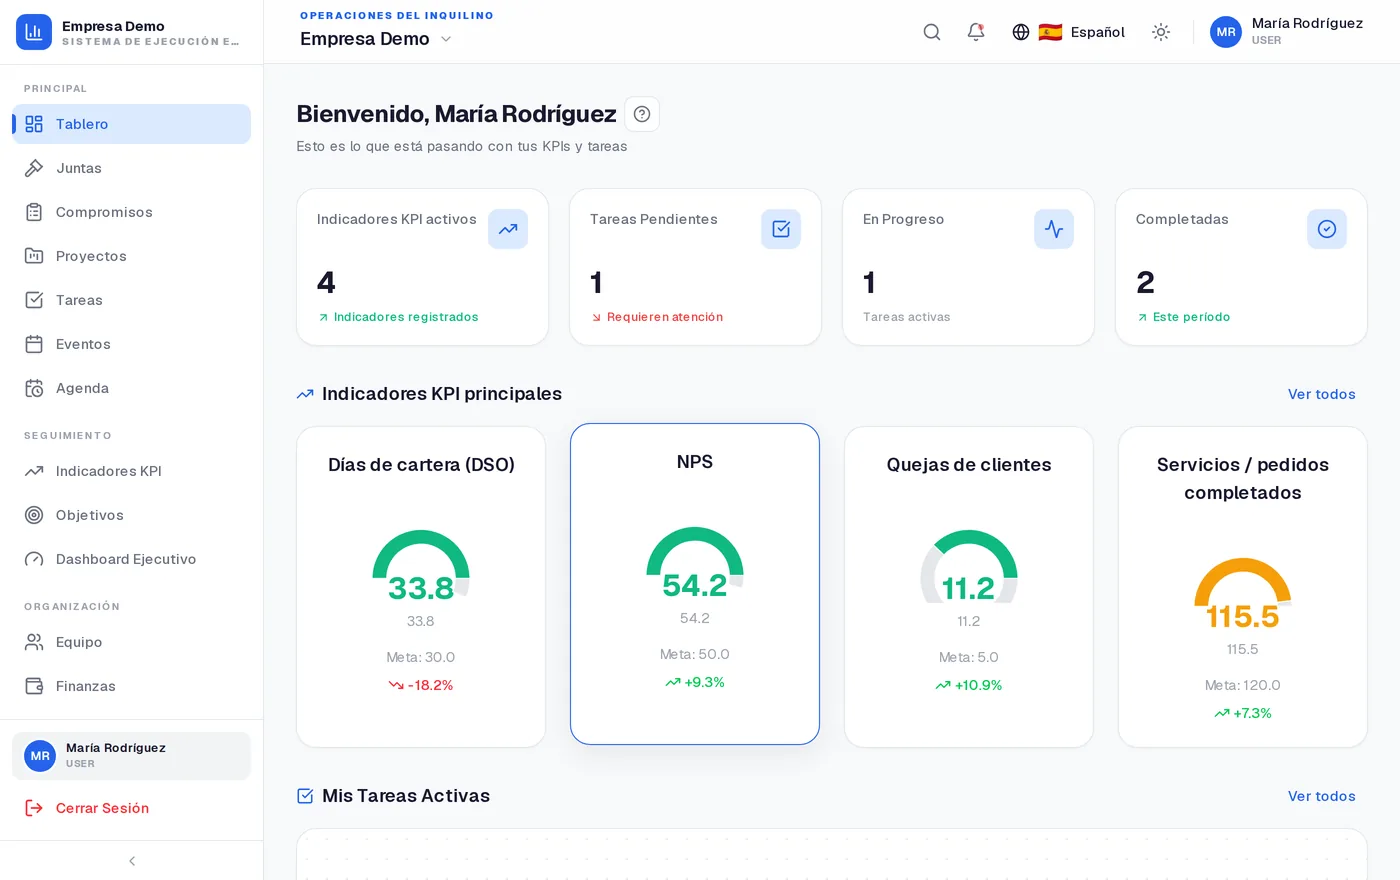
The dashboard opens on what belongs to whoever signed in: their metrics, their progress and whatever fell off target. It is not a month-end report; it is today's picture.
- Key KPIs with target, current value and change
- Personal tasks kept separate from council commitments
- Alerts for anything out of range
The meeting stops living in a notebook
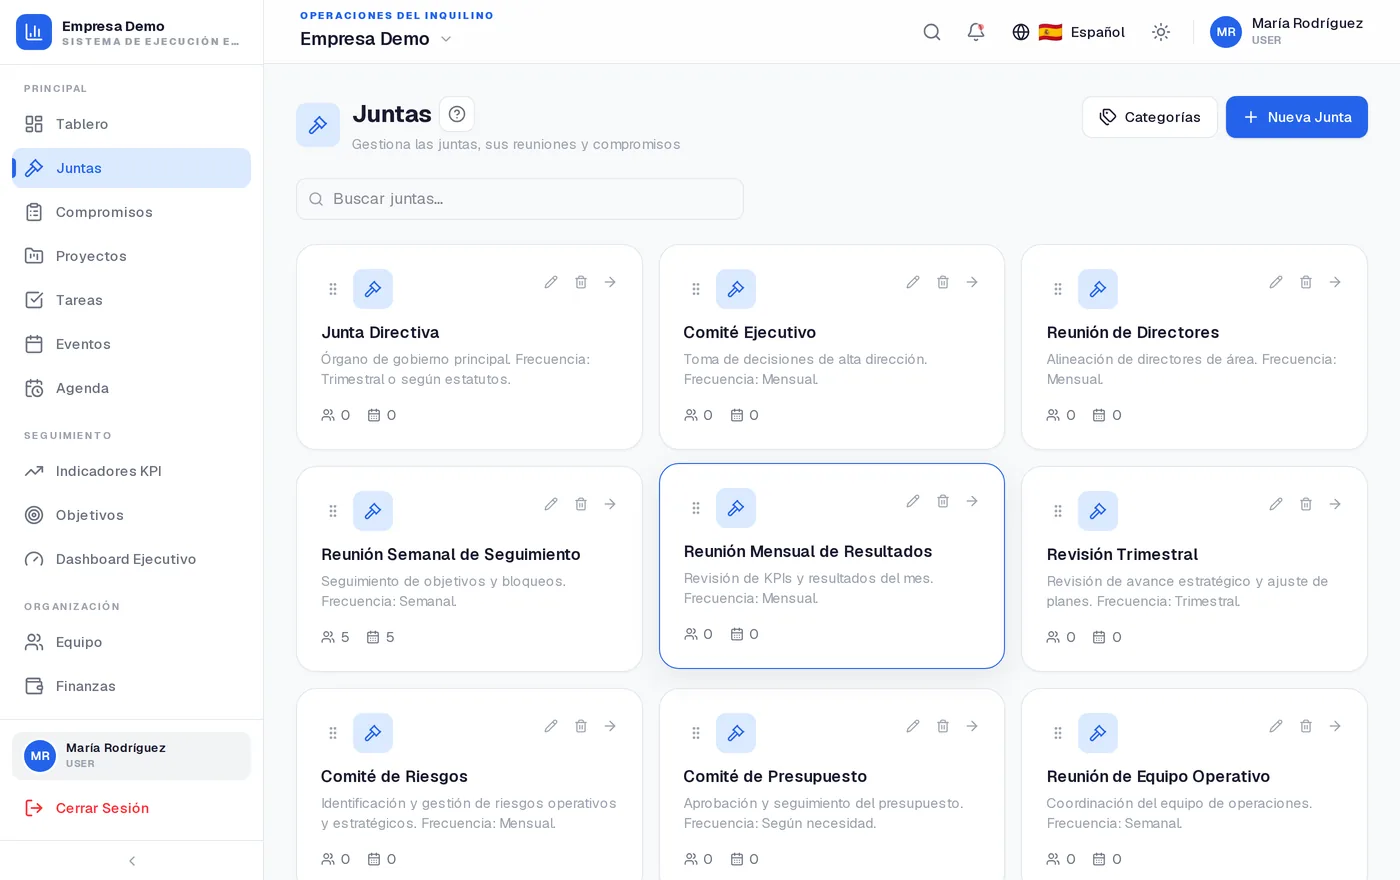
Every council or committee has its agenda, attendance, topics and minutes. The next session opens with whatever was left pending, without depending on anyone's memory.
- Recurring councils per area, location and category
- Agenda, attendance and minutes on one screen
- Commitments are born inside the session
Every decision leaves with an owner and a date
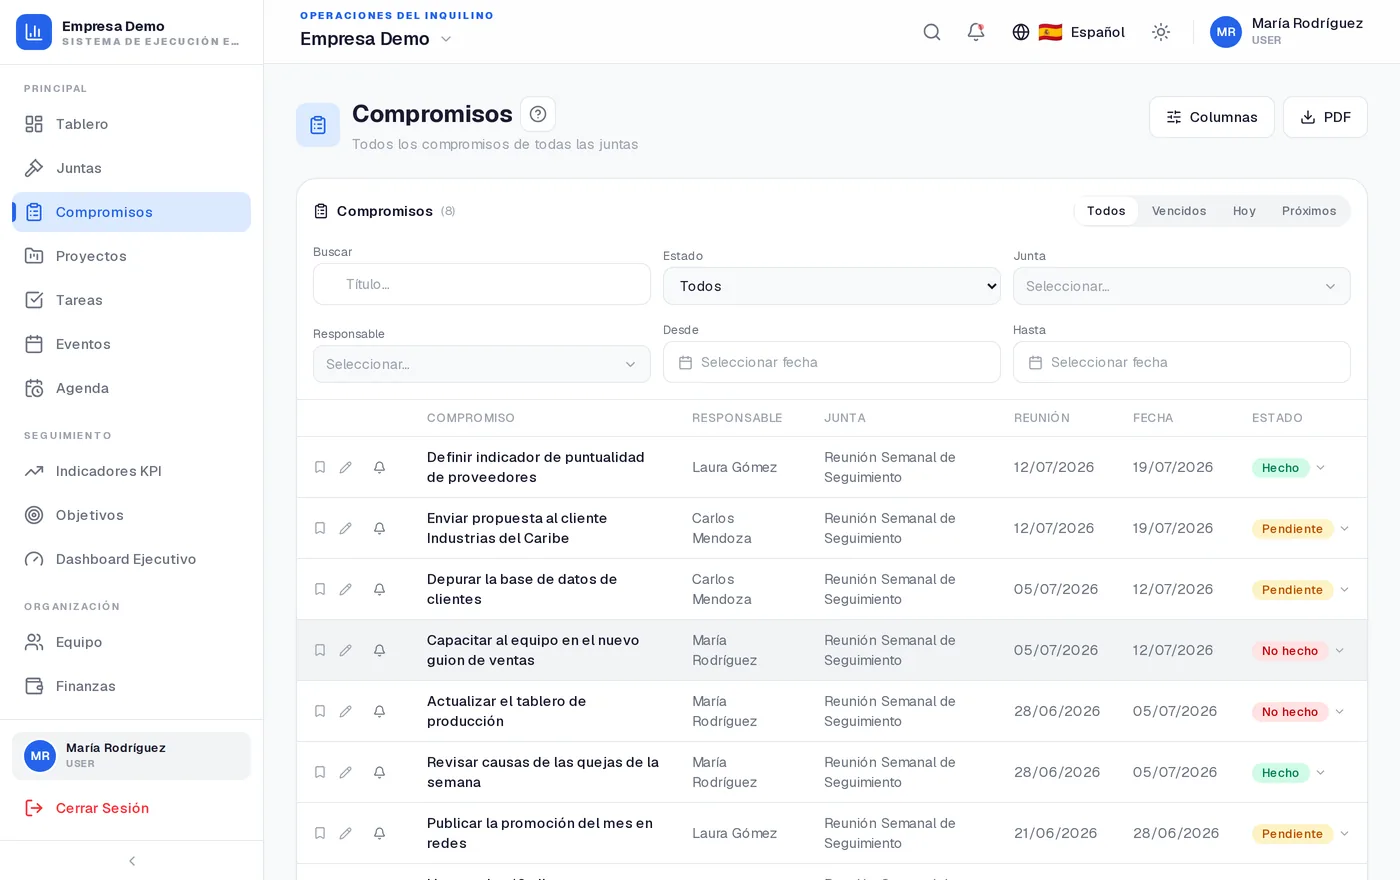
The agreed improvement is the unit of work: nobody leaves a meeting with an ownerless intention. Each one keeps the trail back to the number it was meant to move.
- Automatic reminders over WhatsApp and email
- Completion rate per person and per area
- Overdue items climb onto the next council's agenda by themselves
Metrics for profit, customers and operations
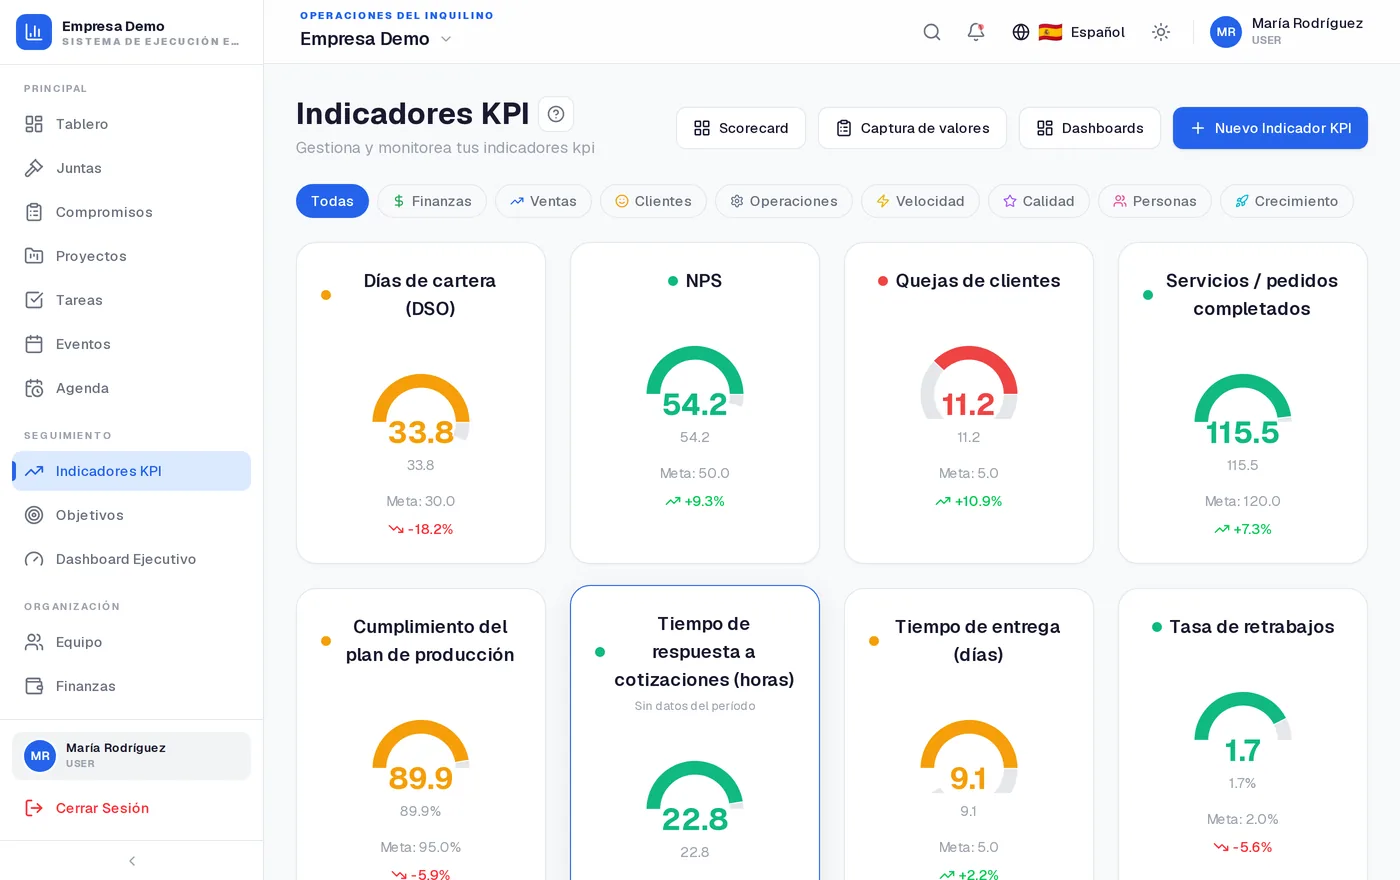
Every metric belongs to an area and an owner, with target, history and a traffic light. When a number turns red it shows up where decisions are made, not in a file.
- Target, current value, trend and traffic light
- Manual entry or calculated from module data
- Per-period history so you see real movement
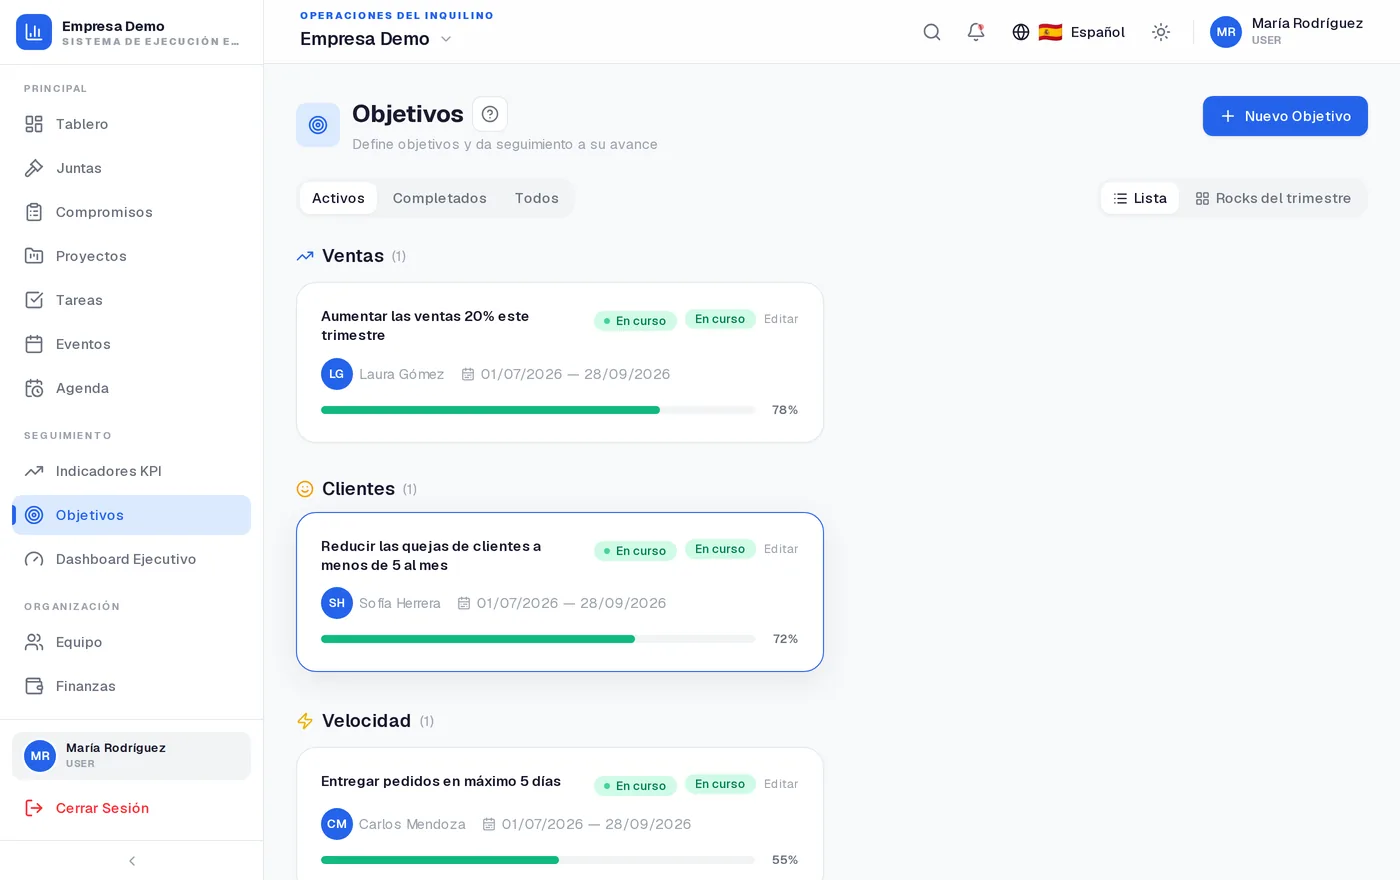
OKRs per area, with calculated progress
Objectives hang off the area chasing them and are measured by key results. Progress comes from the data, not from a feeling typed into a slide.
- Objective → measurable key results
- Progress calculated, not hand-estimated
- Views by quarter and by owner
The whole business in one picture
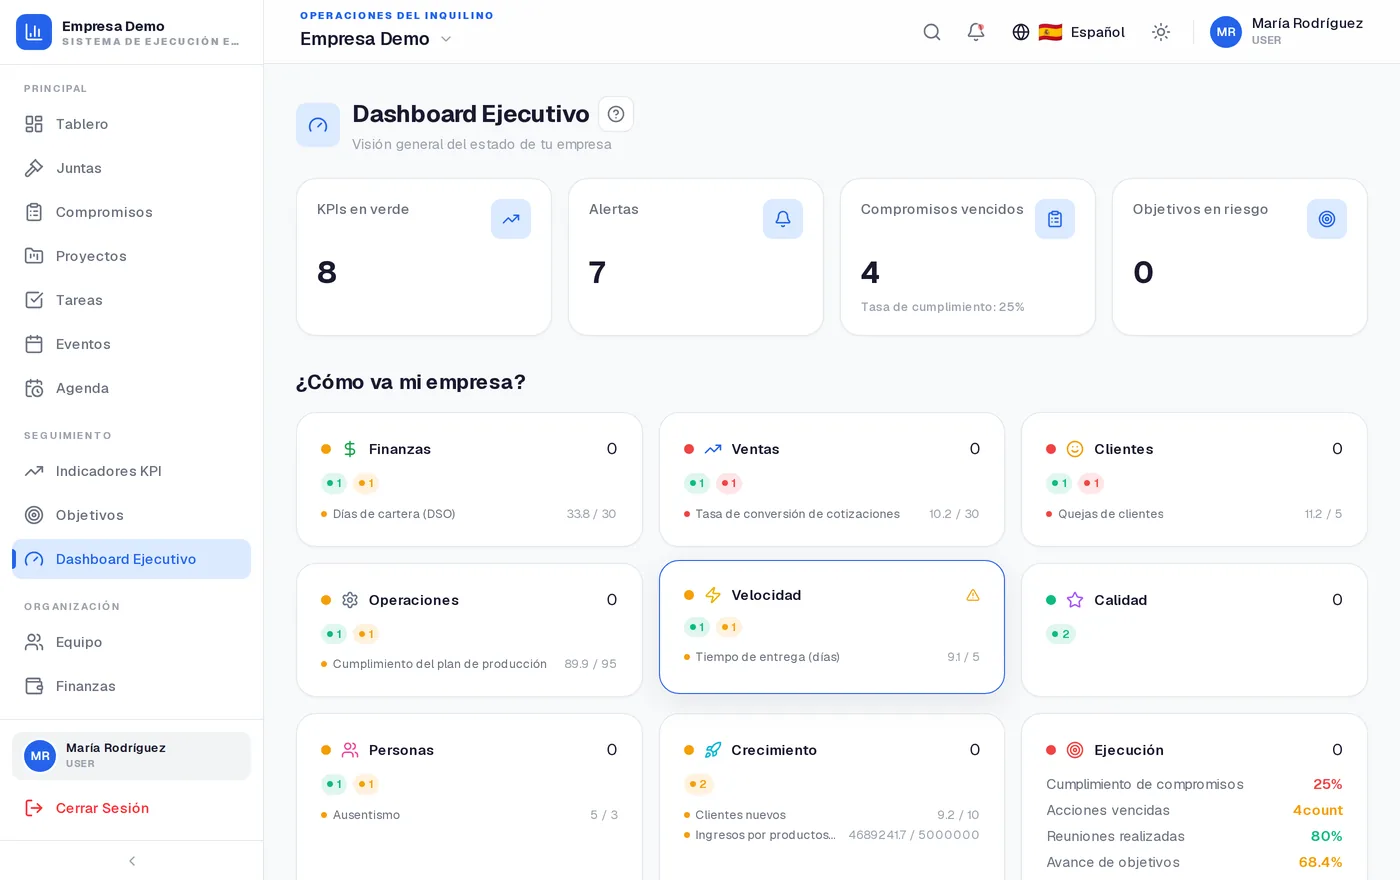
The executive dashboard answers one question: is the company improving? Nine areas with their traffic light, metrics off target, overdue improvements and objectives at risk.
- Health per area with its critical indicators
- Commitment completion and meetings held
- Whatever needs a decision, at the top
See it with your own numbers
Create the organization, pick your industry and set the first target per area. The trial runs 14 days.